How to Analyze Lake Norman Sold Data for Home Valuation
A veteran pilot’s guide to utilizing verified MLS sold records to determine the true market value of Lake Norman waterfront and luxury property.
Direct MLS closing data and professional market analysis for the four counties of Lake Norman.
Navigating the Lake Norman real estate market requires access to accurate, verified data that goes beyond simple estimates. This hub provides direct access to recent Lake Norman sold property records across all four shoreline counties: Mecklenburg, Iredell, Lincoln, and Catawba. Whether you are tracking home values in Mooresville, monitoring luxury trends in Cornelius, or researching the growing markets in Denver and Sherrills Ford, our live MLS-integrated feed delivers the most current closing prices, property details, and sales history available. Use the regional links below to explore specific neighborhood data, or scroll to our market intelligence section for professional analysis of how these recent sales affect your home’s current equity.
#1 Lake Norman Sold Records Hub
Verified MLS Data | Professional Market Intelligence
Mapping the Market: Recent Success Stories Across the Four Counties


Mecklenburg
The Luxury Benchmark: As the primary corridor for Charlotte professionals, Mecklenburg County (Cornelius, Davidson, Huntersville) commands the highest price-per-square-foot. When reviewing these sold records, notice the premium placed on “Close-to-City” convenience paired with deep-water access.
Iredell
- Mooresville
- Troutman
The Waterfront Capital: Mooresville and Troutman offer the most expansive shoreline options. Sold data here is heavily influenced by the “Brawley School Road” luxury corridor. Look for the correlation between linear footage and final sales price – this is where lot value often outweighs the structure. Understanding these recent sold values is the first step in calculating your own home’s equity; for more specialized insights, explore our Selling a Home on Lake Norman: The Ultimate Seller’s FAQ.
Lincoln
- Denver
- Iron Station
The Growth Leader: With the completion of major infrastructure, Denver has become the “East Shore” hotspot. These sold records reflect a rapid appreciation trend. For buyers, the draw here is a lower property tax rate compared to Mecklenburg, allowing for more purchasing power.
Catawba
- Sherrills Ford,
- Terrell
The Scenic Value Play: Sherrills Ford and Terrell offer a “quieter” lake lifestyle with significant acreage. The sold data here shows a balanced market where you often find more “house for the dollar” while still maintaining incredible main channel views and lower carry costs.
Why the Sold Price is Only Half the Story
The “Three L’s” of Lake Norman Valuation
Raw data shows you what a house sold for, but it rarely explains the why. At Lake Norman, property value is dictated by nuanced factors that algorithms often miss. When reviewing recent sales, we categorize value through the “Three L’s”:
- Line of Sight: There is a significant pricing delta between “Main Channel” views, “Cove” frontage, and “Long View” vistas. A home in a quiet cove in Denver may sell for a different premium than a similar square-footage home on the main channel in Cornelius.
- Linear Footage: The amount of shoreline is often more valuable than the heated square footage of the home itself. Rip-rap stabilization and beach quality are key value drivers.
- Local Tax Jurisdictions: Carrying costs vary significantly across the four counties. Iredell and Catawba often offer different tax advantages compared to Mecklenburg, which directly influences a buyer’s purchasing power and the final sold price.
Have questions about a specific sold price? Call Brent: 704-495-4293
Verified MLS Data vs. Estimated Values
Precision-Driven Market Intelligence
In a high-stakes waterfront market, relying on “Automated Valuation Models” (AVMs) is a risk. Most national search portals have a significant error rate because they cannot “see” the quality of a dock or the clarity of a view. We provide the verified alternative:
- Direct-to-MLS Synchronization: Our data is pulled through a live integration with the Canopy MLS—the same gold-standard source used by licensed appraisers, banks, and local tax assessors. This ensures you are viewing actual, verified closing prices, not “estimated” ranges.
- Comprehensive 3-Year Market Archive: Real estate decisions should not be made in a vacuum. We maintain a rolling 3-year window of verified Lake Norman sales to provide a complete perspective on long-term appreciation, seasonal absorption rates, and shifting buyer preferences.
- The “Cycle” Advantage: By analyzing three full market cycles, we offer the contextual intelligence needed to separate short-term market volatility from true, sustainable property value growth. This allows you to identify trends that a 6-month snapshot simply cannot capture.
- Appraisal-Grade Logic: We organize our sold data to mirror the way professionals evaluate property. By focusing on “Like-for-Like” comparisons across the four counties, we help you understand your home’s position in the current competitive landscape.
Strategic Market Analysis: Beyond the Closing Price
Data alone doesn’t tell the full story of the Lake Norman shoreline. Our proprietary market intelligence reports bridge the gap between raw closing prices and actual property equity. Each month, we analyze the shifting inventory levels, absorption rates, and sale-to-list price ratios across the four counties of Lake Norman to provide a clear picture of localized trends. Whether you are tracking the luxury waterfront market in Mooresville or the rapid appreciation of new construction in Denver, these deep dives offer the expert context needed to turn historical sold data into a forward-looking strategy for your home’s value.
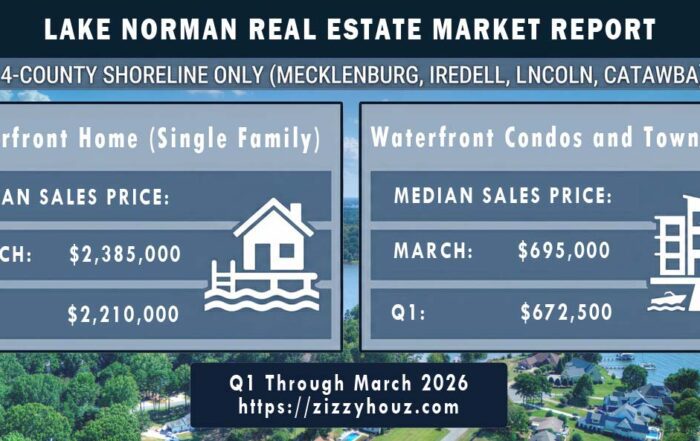
Final Q1 2026 Lake Norman Waterfront Report: Verified Data
March 2026 & Q1 Dashboard 4-County Shoreline Aggregate 🏠 [...]

February 2026 Lake Norman Waterfront Market Analysis
February 2026 Waterfront Dashboard 4-County Shoreline Aggregate 🏠 SF Waterfront [...]
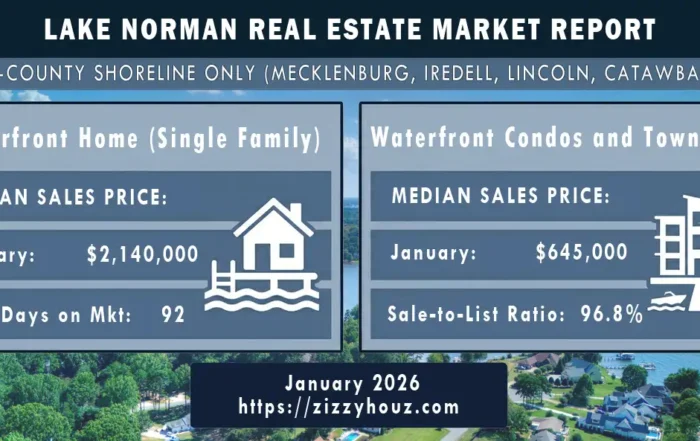
January 2026 Lake Norman Waterfront Market Report
January 2026 Waterfront Dashboard 4-County Shoreline Aggregate 🏠 SF Waterfront [...]
Ready to move from market data to your next front door?
While understanding sold history is the first step, finding the right home is the goal. Explore our curated list of active Lake Norman listings, updated every 15 minutes directly from the MLS.
Lake Norman Real Estate FAQ
Q: How do I access verified Lake Norman MLS sold property records?
A: While public sites offer estimates, the only way to access verified Lake Norman MLS sold property records is through a direct-to-MLS synchronized feed. Our portal provides real-time closing data across Mecklenburg, Iredell, Lincoln, and Catawba counties, ensuring you see actual contract prices, concessions, and days-on-market metrics used by licensed appraisers.
Q: What are the property tax differences across Lake Norman’s four counties?
A: Property taxes are a major factor in Lake Norman real estate valuation. Historically, Iredell and Catawba counties offer lower millage rates than Mecklenburg, which can significantly increase a buyer’s purchasing power. We analyze these local tax jurisdictions in every sold record to provide a true ‘net carry cost’ for waterfront estates.
Q: How does linear footage impact Lake Norman waterfront home values?
A: In the Lake Norman market, linear footage is often more valuable than heated square footage. Shoreline stabilization (Rip-rap) and Duke Energy dock permitting classifications create a massive pricing delta. Our market intelligence reports distinguish between ‘Main Channel’ and ‘Cove’ sales to explain why two similar homes may have a $500,000 difference in sold price.
Q: When is the best time to review Lake Norman sold data for market timing?
A: To accurately time the market, you must look at a rolling 3-year window of verified sales. This ‘Cycle Advantage’ allows you to see past seasonal absorption rates and identify true equity growth. Tracking the Sale-to-List price ratio across the four shoreline counties is the most aggressive way to determine if the current market favors high-end sellers or opportunistic buyers.