Article Category and Author

Admin
Share
New Listings Today


Huntersville Home Prices: A Dramatic Five-Year Climb (2020-2025)
Listen to the ZizzyCast instead of reading.
The Huntersville average sell price has been on a tear since 2020. What do you think the future holds? Stay tined or contact Brent Dillon, REALTOR for the most up to date information from the Canopy MLS system.
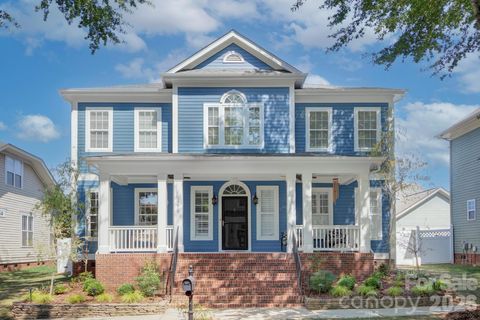
The Huntersville, North Carolina real estate market has been on a remarkable journey over the past five years. There has been a dramatic increase in prices over the past 5 years. Data tracking the average monthly closing prices from January 2020 through April 2025 reveals a period of significant transformation and substantial appreciation, showcasing the area’s strong draw for homebuyers.
Starting Point and Early Growth (2020-2021)
In early 2020, the Huntersville market saw average closing prices generally hovering in the $360,000s to just under $400,000. For instance, January 2020 recorded an average price of $396,056. While there was a slight dip noted in early 2021 (Jan 2021 average: $360,899), prices quickly regained momentum. Throughout 2021, the market showed consistent growth, with average closing prices firmly establishing themselves above the $400,000 mark by April ($409,183) and reaching over $500,000 by November ($501,906).
Rapid Acceleration (2022)
The year 2022 marked a period of particularly rapid acceleration. Average closing prices started strong at $493,358 in January and consistently stayed above the half-million-dollar mark for the entire year. The market pushed towards $550,000 and beyond, indicating intense demand and competition among buyers (e.g., September 2022 average: $566,008).
Reaching New Heights and Stabilization (2023-2024)
Prices continued their upward trajectory into 2023, frequently exceeding $550,000 and hitting averages over $600,000 in several months (e.g., April 2023: $608,469; October 2023: $631,110). However, comparing early 2024 to early 2023 suggests a period of relative stabilization or slight cooling. January 2024’s average ($563,574) was slightly below January 2023 ($584,875), and April 2024 ($552,076) was also lower than April 2023 ($608,469). Despite this pause in year-over-year monthly growth, prices remained significantly elevated compared to 2020 levels.
Renewed Surge (Late 2024 – Early 2025)
Any plateau appeared short-lived. The latter half of 2024 saw prices climbing again, with October 2024 hitting a new high average of $700,341 according to the data. This momentum carried forcefully into 2025. January 2025 started strong at $609,942, and by April 2025, the average closing price reached $692,545 – the highest point recorded in the provided five-year dataset.
The Five-Year Perspective: Significant Gains
Looking back roughly five years from the latest data point, the growth is striking. The average closing price in April 2020 was $370,802. By April 2025, it had surged to $692,545. This represents an increase of approximately $321,743, or a remarkable 86.8% rise over that five-year period.
Conclusion About Home Prices in Huntersville, NC
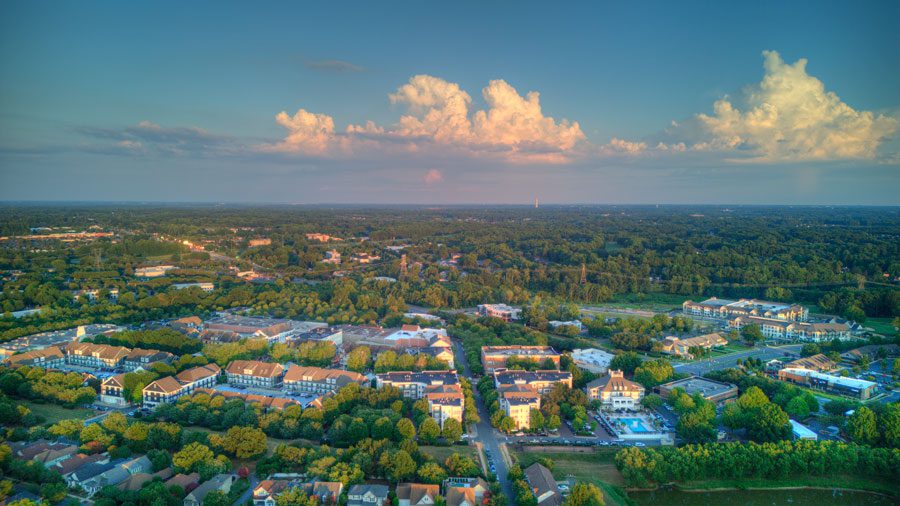
The journey of Huntersville home prices from early 2020 to early 2025 has been dynamic, characterized predominantly by strong and significant appreciation. While the market experienced periods of explosive growth followed by some stabilization, the overarching trend has been a dramatic climb in home values. This data underscores Huntersville’s continued appeal as a desirable place to live in the greater Charlotte region.
Huntersville Homes Sold Data for the Past 5 Years by Month
| Month | Close Price, Average 2020 | Close Price, Average 2021 | Close Price, Average 2022 | Close Price, Average 2023 | Close Price, Average 2024 | Close Price, Average 2025 |
| Jan | $396,056 | $360,899 | $493,358 | $584,875 | $563,574 | $609,942 |
| Feb | $364,224 | $392,970 | $522,385 | $540,765 | $574,432 | $586,794 |
| Mar | $369,395 | $431,425 | $496,600 | $566,033 | $601,876 | $604,266 |
| Apr | $370,802 | $409,183 | $530,062 | $608,469 | $552,076 | $692,545 |
| May | $347,433 | $447,423 | $558,872 | $642,113 | $594,519 | |
| Jun | $361,062 | $440,879 | $547,785 | $578,650 | $636,471 | |
| Jul | $371,893 | $459,481 | $523,759 | $567,262 | $597,123 | |
| Aug | $380,049 | $442,546 | $545,329 | $549,588 | $599,291 | |
| Sep | $391,676 | $471,705 | $566,008 | $599,220 | $557,686 | |
| Oct | $378,053 | $468,760 | $569,492 | $631,110 | $700,341 | |
| Nov | $359,111 | $501,906 | $550,995 | $549,475 | $656,668 | |
| Dec | $402,066 | $501,959 | $539,846 | $567,038 | $656,806 |
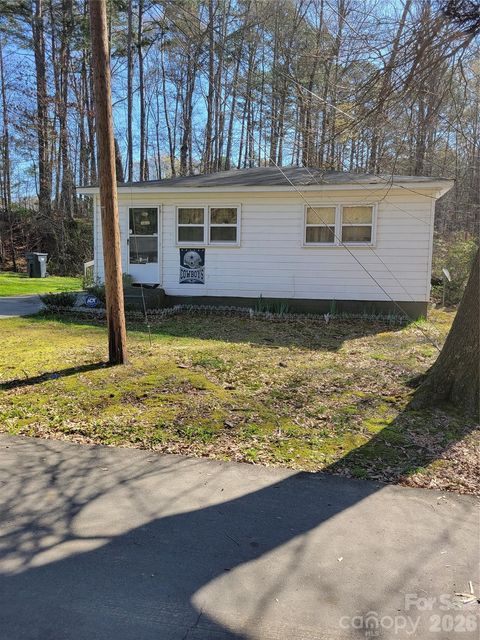
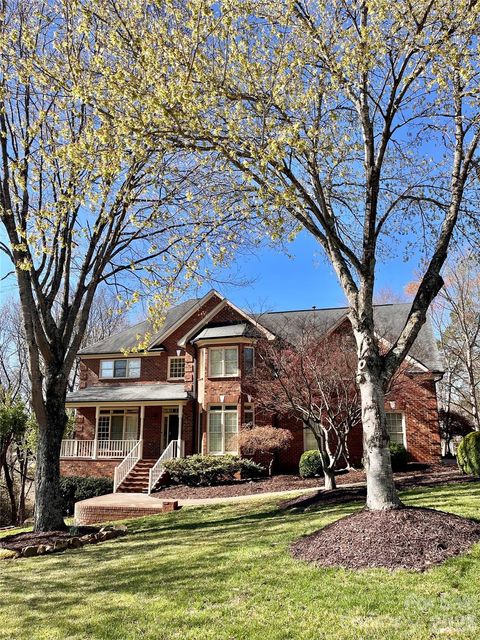
Find Homes for Sale in Huntersville, NC 28078 Below:

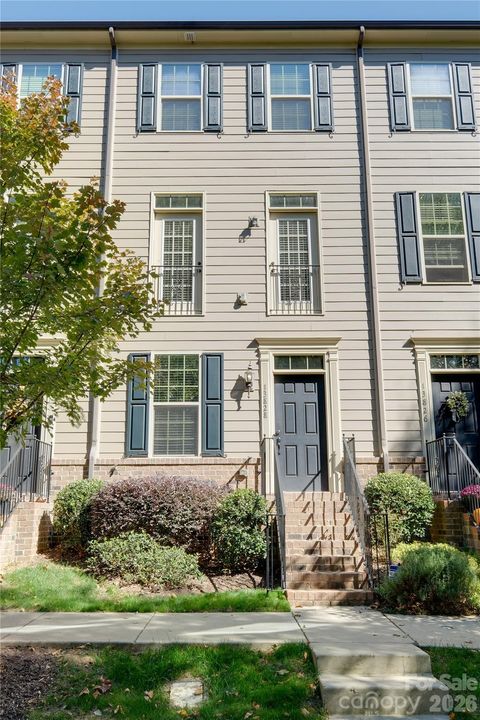


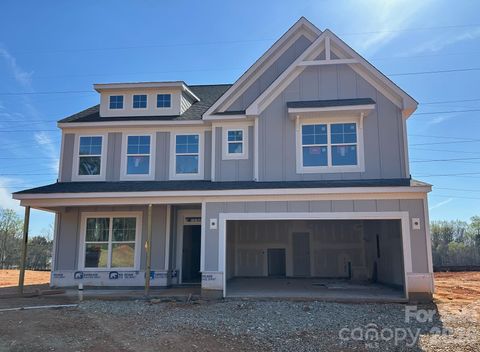


Full Advanced Search
Editor's Pick
What Our Customers Say
“I went under contract on my home, one hour after he listed the property.”
"Brent Dillon is the reason that the process of selling of my home and buying a new home in Florida went flawlessly. Brent was there every step of the way, guiding me and making me [...]